Numbers
What happens in the workshop, in numbers, not impressions.
Dashboards show the current situation without asking anyone for a report. And when you have a question no standard report answers, you build the view yourself.
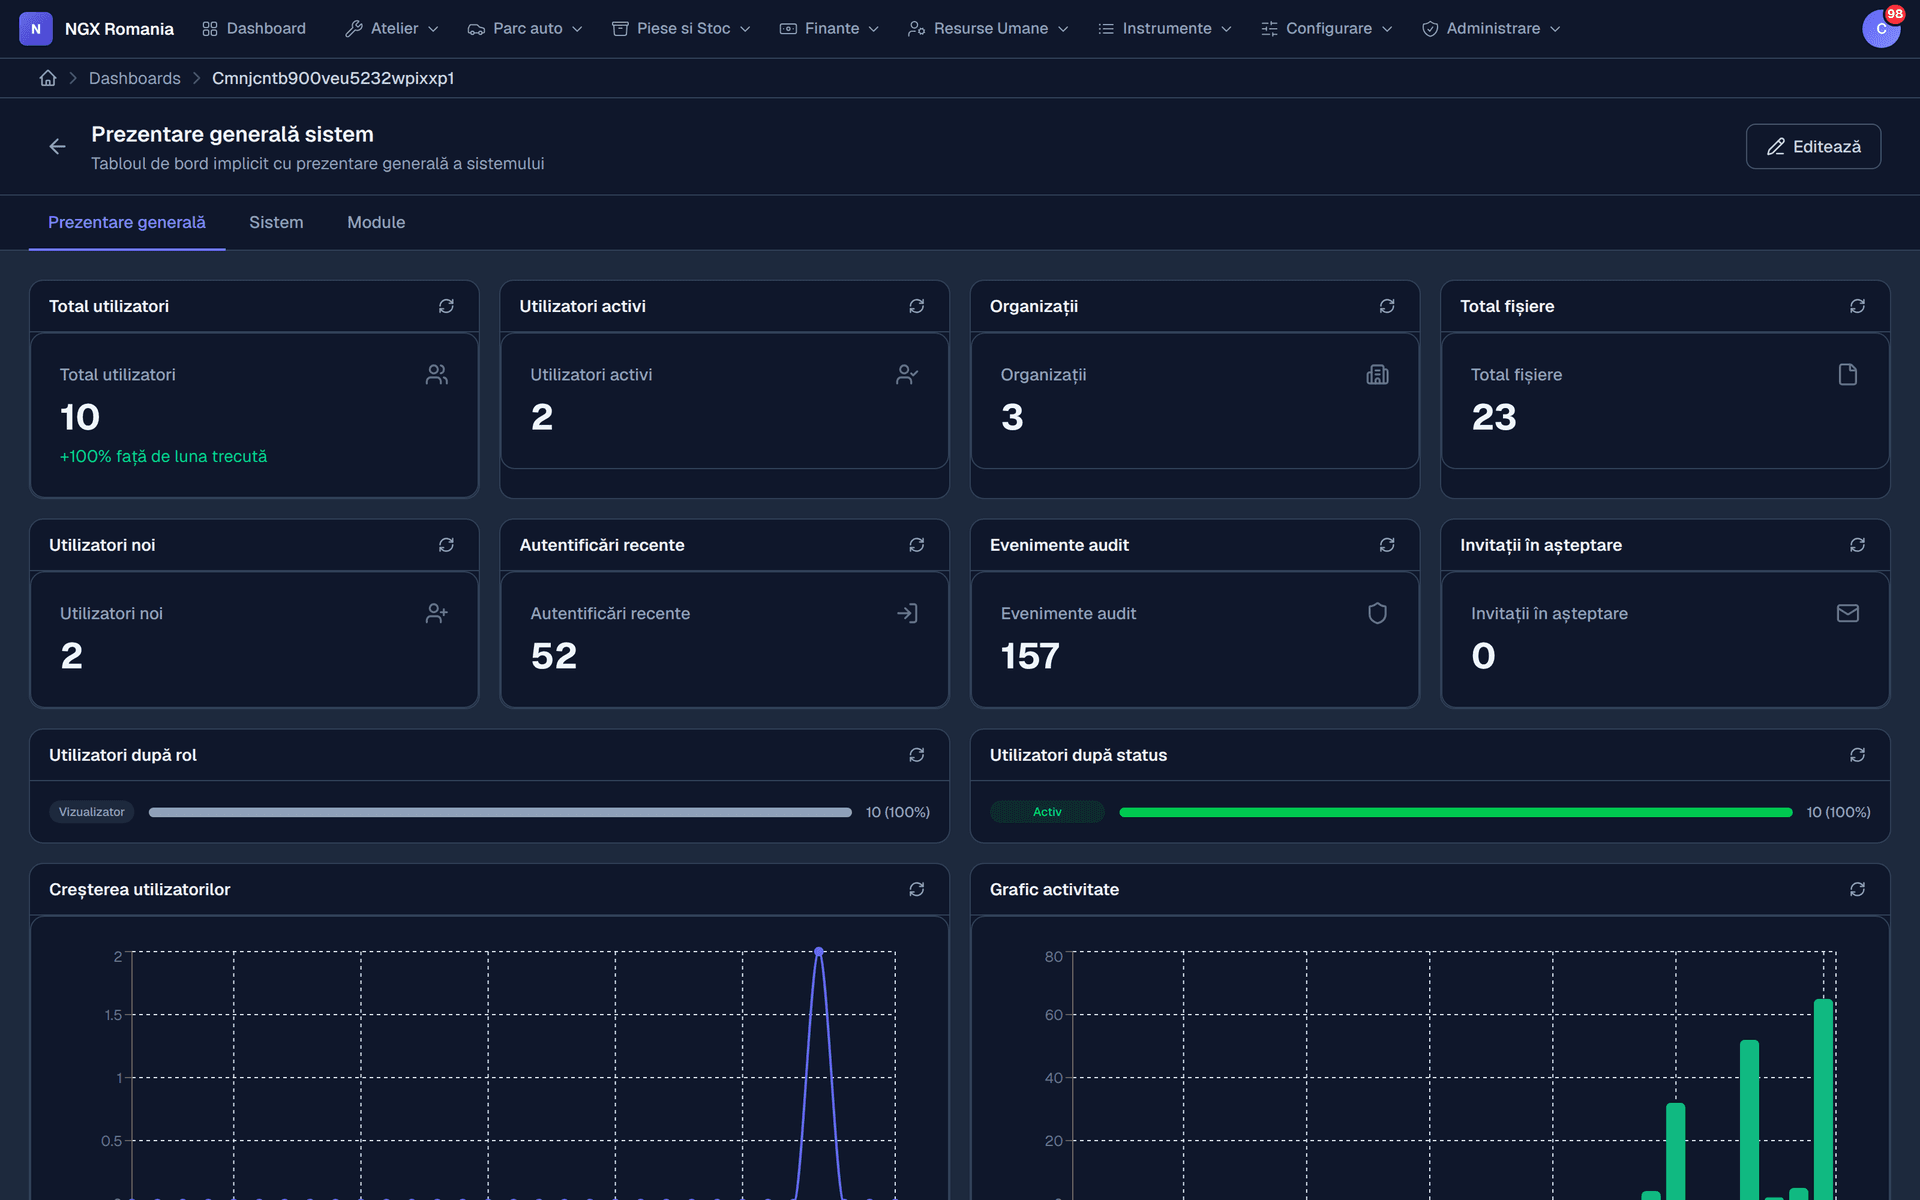
What you see
The indicators that matter in a workshop
- Vehicles in the shop
How many cars are on the bays right now and for how long.
- Open jobs
By status, so you can see where the flow gets stuck.
- Revenue
Invoiced, collected, outstanding.
- Productivity
Labour hours per mechanic and per period.
- Parts consumption
What moves out of the store and at what margin.
- Your own queries
A visual builder for views you save and return to.
How they are built
The dashboards are yours, not ours
A dashboard is made of rows, and each row splits into quarters, halves or full width. Into each slot you drop a widget: an indicator, a chart, a list or a block of quick actions.
A dashboard can carry several tabs — workshop, people, planning, system — and can be private or visible to the whole company. They export and import, so a configuration built at one location moves to another without being rebuilt.
- Rows and slots Split the row into quarters or halves, then pick the widget.
- Private or company-wide Each dashboard carries its own visibility.
- Export and import Move a configuration between locations as a file.
When the standard report is not enough
The query builder
Every workshop has its own question: how many warranty returns this year, which part moves worst, which mechanic logs the most hours on one make.
The query builder lets you pick the data, the conditions and the order, then save the query and reopen it whenever you like. You ask nobody for a report and you wait for no new release.
- Visual, not written Fields and conditions come from lists, with no query language.
- It is saved A question asked once stays available.
- It reaches the dashboard A saved query can become a widget.
What you usually track
The questions a workshop owner asks
- How many cars are in the shop now and how long each has been there
- Where the flow stalls — on parts, on estimate approval or on invoicing
- How much was invoiced this month and how much actually came in
- What margin is left after the cost of parts, on each job
- How many labour hours each mechanic logged
- Which parts sit in the store without moving
- How many jobs come back for the same problem
- How long a job takes on average, from arrival to handover
Frequently asked questions
What reports do I get?
Dashboards with workshop indicators — open jobs, revenue, vehicles in the shop, productivity — plus a query builder for your own views, which you can save and return to.
Can I see how much I make on a job?
Yes. Because the purchase price comes from the supplier invoice and labour comes from the department's hourly rate, you can compare revenue with real cost on every work order.
Can I connect NGX to other software?
Yes. The app sends webhooks on important events — order created, status changed, invoice issued — and exposes API keys for external systems, so you can connect accounting, a CRM or any service of your own.
Is my data separated from other companies?
Yes. Each organisation has its own data — customers, vehicles, work orders, invoices, files — and a user only sees the organisations they belong to. If you run several locations you can keep separate organisations and switch between them from the header.
See the dashboards in the demo
With enough test data for the charts to make sense.